Colorful Republic
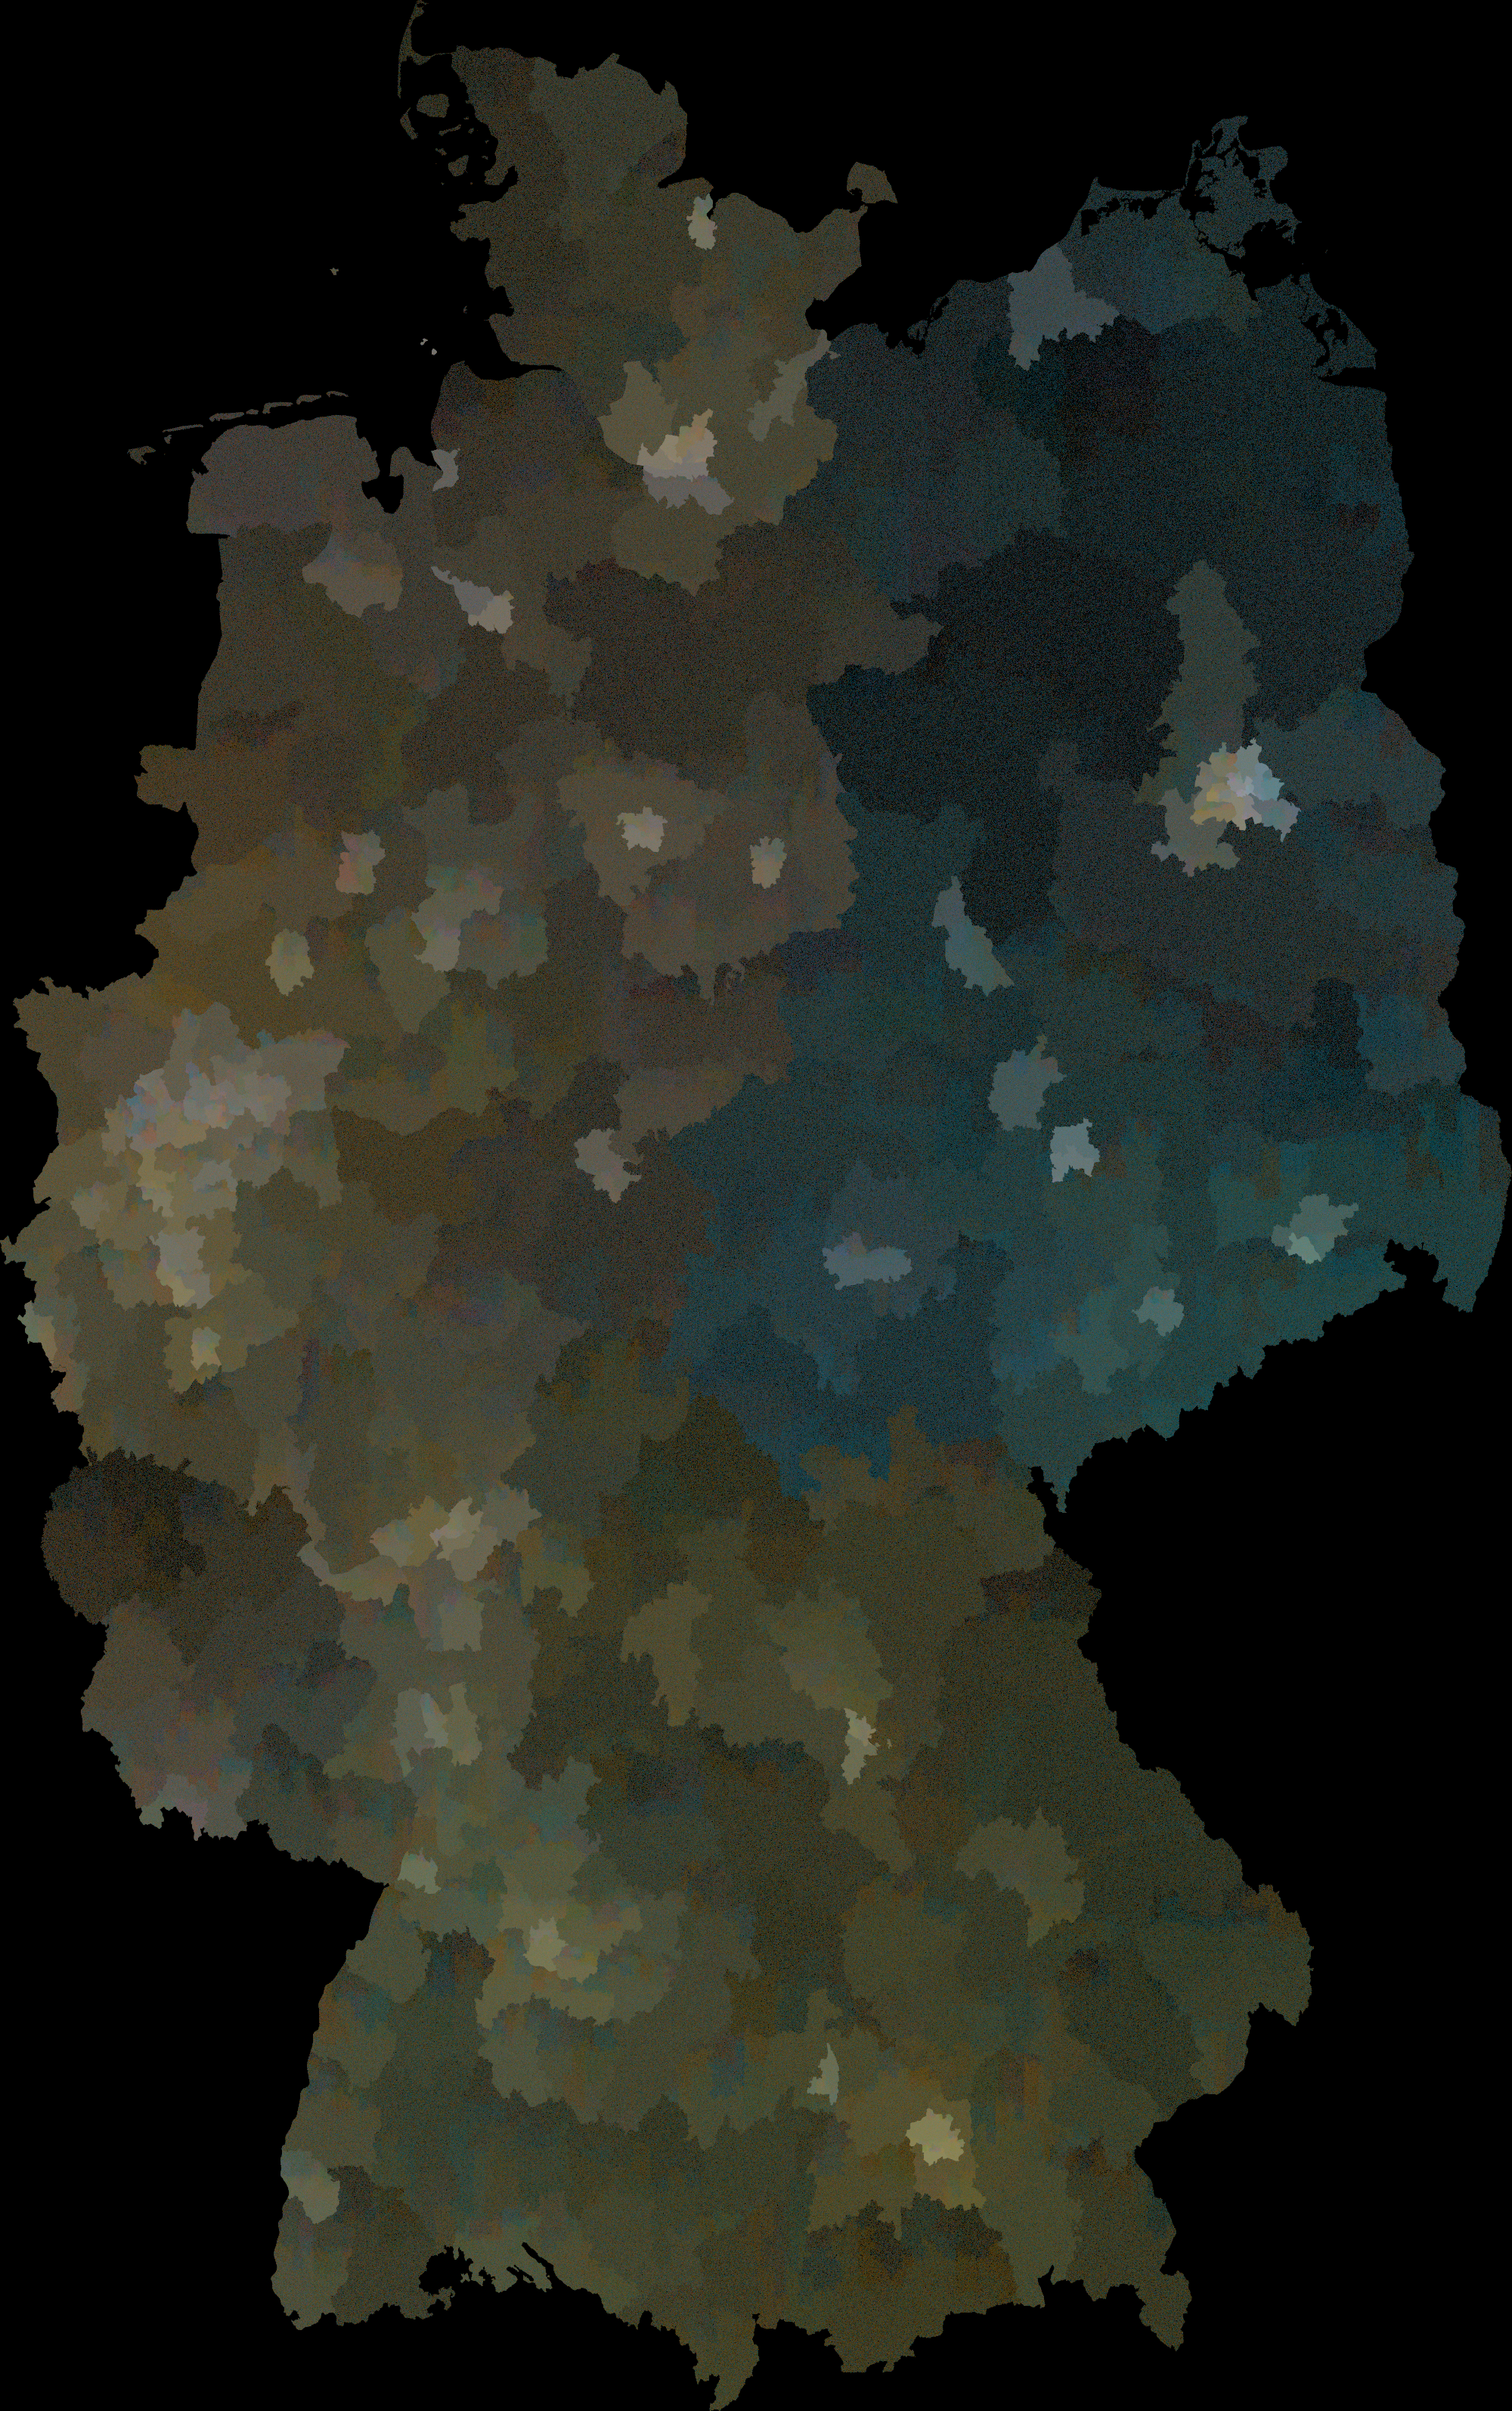
Last month, Germany elected a new parliament. I have seen many maps (e.g. Die Zeit, Der Spiegel, this post on r/dataisbeautiful), but I always felt that coloring the map using either a single party or using the dominant party hides the how diverse the country really is. This is why I set out to create my own version.
The above map shows one dot for every party vote (technically the “Zweitstimme”) for the relevant parties:
- AfD
- CDU/CSU
- Die Linke
- Grüne
- SPD
Data
Luckily the official authority – called Bundeswahlleiterin provides very good machine readable data:
- Districts: I have used the WGS84 Shapefile.
- Votes: The offer a “flat” CSV, link is on the lower right side of the page.
Processing
The entire processing was done in Python in a marimo notebook:
- Disticts: Download data using requests, load the data using Fiona, and convert it into a GeoPandas data frame. Only keep the
geometryand theWKR_NR(which is the district ID). - Votes: Download data using requests, load data using Pandas, filter data.
- Join: Join data using Pandas.
- Colors: Pick 5 colors from the Oklch using ColorAide and the Oklch Color Picker. Convert them to sRGB hex and use Pandas to assign the mapping.
- Sample: Sample a points in each district that equals the number of votes for each party, using GeoPandas.
- Render: Render the points using Datashader. Using the
dynspreadfunction to smooth the map a bit and alogshading.
Here is the entire notebook that you can load into marimo (click the arrow to expand):Code for
notebook.py# /// script
# requires-python = ">=3.12"
# dependencies = [
# "coloraide==4.4.1",
# "datashader==0.17.0",
# "fiona==1.10.1",
# "geopandas==1.0.1",
# "marimo",
# "matplotlib==3.10.1",
# "numpy==2.1.3",
# "pandas==2.2.3",
# "requests==2.32.3",
# ]
# ///
import marimo
__generated_with = "0.11.24"
app = marimo.App()
@app.cell(hide_code=True)
def _(mo):
mo.md(r"""# German Election 2025""")
return
@app.cell(hide_code=True)
def _(mo):
mo.md(r"""## Setup""")
return
@app.cell
def _():
import io
import zipfile
import datashader as ds
import datashader.transfer_functions as tf
import geopandas as gpd
from matplotlib import pyplot as plt
import marimo as mo
import numpy as np
import pandas as pd
import coloraide
import fiona.io
import requests
return (
coloraide,
ds,
fiona,
gpd,
io,
mo,
np,
pd,
plt,
requests,
tf,
zipfile,
)
@app.cell(hide_code=True)
def _(mo):
mo.md(
r"""
## Districts
Data from <https://www.bundeswahlleiterin.de/bundestagswahlen/2025/wahlkreiseinteilung/downloads.html>.
"""
)
return
@app.cell
def _(fiona, gpd, requests):
_resp = requests.get(
"https://www.bundeswahlleiterin.de/dam/jcr/a3b60aa9-8fa5-4223-9fb4-0a3a3cebd7d1/btw25_geometrie_wahlkreise_vg250_shp_geo.zip"
)
_resp.raise_for_status()
with fiona.io.ZipMemoryFile(_resp.content) as zf:
print(f"zip content: {zf.listdir()}")
with zf.open("btw25_geometrie_wahlkreise_vg250_shp_geo.shp") as collection:
districts = gpd.GeoDataFrame.from_features(
collection, crs=collection.crs
)
districts
return collection, districts, zf
@app.cell
def _(districts):
districts_1 = districts.loc[:, ["geometry", "WKR_NR"]]
districts_1
return (districts_1,)
@app.cell
def _(districts_1):
districts_1.plot()
return
@app.cell(hide_code=True)
def _(mo):
mo.md(
r"""
## Votes
Data from <https://www.bundeswahlleiterin.de/bundestagswahlen/2025/ergebnisse.html>
"""
)
return
@app.cell
def _(io, pd, requests):
_resp = requests.get(
"https://www.bundeswahlleiterin.de/dam/jcr/f49a47a1-735b-4e9b-b4e1-4c73cad2292e/btw25_kerg2.csv"
)
_resp.raise_for_status()
votes = pd.read_csv(io.BytesIO(_resp.content), sep=";", skiprows=9)
votes
return (votes,)
@app.cell
def _(votes):
votes_1 = (
votes.loc[
(votes["Gebietsart"] == "Wahlkreis")
& (votes["Gruppenart"] == "Partei")
& (votes["Stimme"] == 2)
& ~votes["Anzahl"].isnull(),
["Gebietsnummer", "Gruppenname", "Anzahl"],
]
.rename(columns={"Gebietsnummer": "WKR_NR"})
.astype({"Anzahl": int})
.reset_index(drop=True)
)
votes_1
return (votes_1,)
@app.cell(hide_code=True)
def _(mo):
mo.md(r"""## Join Data""")
return
@app.cell
def _(districts_1, gpd, votes_1):
joined = gpd.GeoDataFrame(votes_1.merge(districts_1), crs=districts_1.crs)
joined
return (joined,)
@app.cell(hide_code=True)
def _(mo):
mo.md(r"""## Find Colors""")
return
@app.cell
def _(coloraide):
n_colors = 5
colors = [
coloraide.Color(
"oklch",
[0.71, 0.16, 360 / n_colors * i],
)
for i in range(n_colors)
]
colors_hex = [c.convert("srgb").to_string(hex=True) for c in colors]
colors
return colors, colors_hex, n_colors
@app.cell
def _(colors_hex, joined):
parties = joined["Gruppenname"].unique()
mapping = {
"AfD": colors_hex[3],
"CDU": colors_hex[1],
"CSU": colors_hex[1],
"Die Linke": colors_hex[4],
"GRÜNE": colors_hex[2],
"SPD": colors_hex[0],
}
missing = set(parties) - set(mapping)
if missing:
print(f"missing mapping for parties: {sorted(missing)}")
joined["color"] = joined["Gruppenname"].map(mapping)
joined_1 = joined.loc[~joined["color"].isnull()].reset_index(drop=True)
return joined_1, mapping, missing, parties
@app.cell(hide_code=True)
def _(mo):
mo.md(r"""## Sample Points""")
return
@app.cell
def _(joined_1):
joined_1["geometry"] = joined_1["geometry"].sample_points(
size=joined_1["Anzahl"]
)
return
@app.cell
def _(joined_1):
to_plot = (
joined_1.loc[:, ["geometry", "Gruppenname"]]
.astype({"Gruppenname": "category"})
.explode()
.sample(frac=1)
.reset_index(drop=True)
)
return (to_plot,)
@app.cell
def _(np):
# See https://github.com/geopandas/geopandas/blob/99d5cc98b19d4e1d70a0fd81d68d1f5f453a48d9/geopandas/plotting.py#L381C12-L384
def calculate_aspect_ratio(df):
s = df["geometry"]
assert s.crs and s.crs.is_geographic
bounds = s.total_bounds
y_coord = np.mean([bounds[1], bounds[3]])
return 1 / np.cos(y_coord * np.pi / 180)
return (calculate_aspect_ratio,)
@app.cell
def _(calculate_aspect_ratio, ds, mapping, mo, np, tf, to_plot):
size = 2000
canvas = ds.Canvas(
plot_width=size,
plot_height=int(np.floor(size * calculate_aspect_ratio(to_plot))),
)
agg = canvas.points(
to_plot,
geometry="geometry",
agg=ds.by("Gruppenname"),
)
agg = tf.dynspread(
agg,
threshold=0.8,
max_px=10,
)
shade = tf.shade(
agg,
color_key=mapping,
how="log",
)
shade = tf.set_background(shade, "black")
ds.utils.export_image(shade, "election", export_path=mo.notebook_dir())
return agg, canvas, shade, size
if __name__ == "__main__":
app.run()
Interpretation
I leave it to the reader to form their own opinion.